Impact Analysis
Overview
Impact Analysis illustrates the effect of change exerted by an artifact on its related artifacts. This allows for an understanding of the full impact of change, and the ability to estimate time and resources more accurately. Any artifact can be used as the starting point of Impact Analysis.
To initiate Impact Analysis
-
Navigate to an artifact in your project that has a relationship indicator

-
Click the Impact Analysis icon in the Relationships group on the ribbon

-
The Impact Analysis module will open in a new browser tab
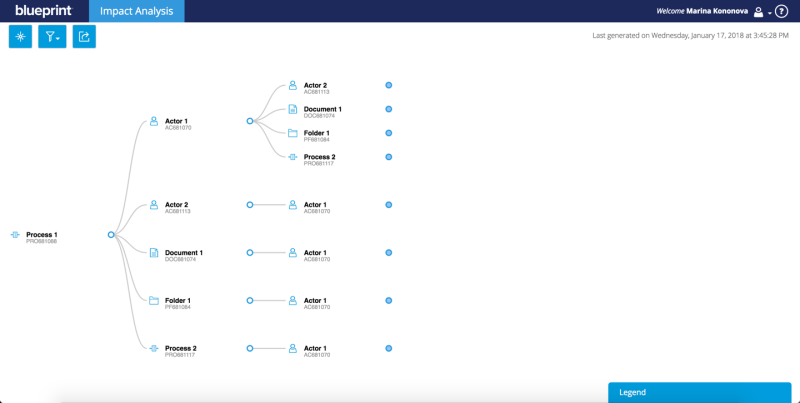
The default display will expand the tree of relationships to three levels.
-
A solid blue circle beside an artifact indicates that there may be another level that can be expanded.
-
Once clicked, if the circle turns grey, it is the last artifact in that branch.
-
Once a branch is expanded, you can collapse it by clicking the hollow blue circle next to the artifact.
-
A loop icon
 indicates that this artifact has a loop back to an artifact in the same relationship. Impact Analysis will not display additional branches from an artifact with this icon.
Each time Impact Analysis is generated, it will be time stamped with a date and time (shown in your local time).
Impact Analysis Interface
There are three icons located in the top left of the main screen that allow you to customize your Impact Analysis experience.
 The Source icon allows you to change the source (root) of the highest-level artifact in the tree view, by entering its product ID.
 The Filter icon allows you to change the artifact types that are displayed in the tree view. The list of artifact types is displayed based on the project relationships, and is organized by project in the filter menu. Here, you can also choose whether or not you want the artifact's parents displayed (by default, Show Parents is enabled).
 The Export to Excel icon allows you to export the Impact tree to an Excel document for further analysis.
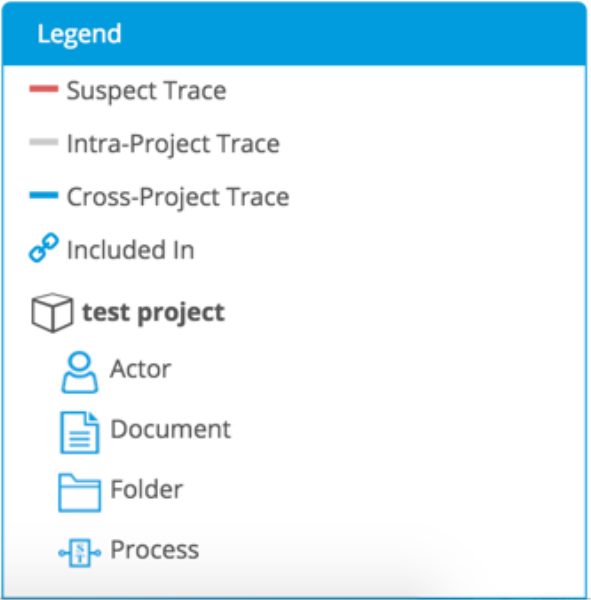
The Legend, located in the bottom-right corner, displays the icon and title of each artifact type that is displayed in the Impact tree. The artifacts in the Legend are grouped by project. Traces between artifacts can be intra or cross-project, and suspect traces will also be displayed. These are represented by different colored lines (shown in the Legend). Additionally, any artifact with an Include will be shown with an indicator.
Properties and Discussions
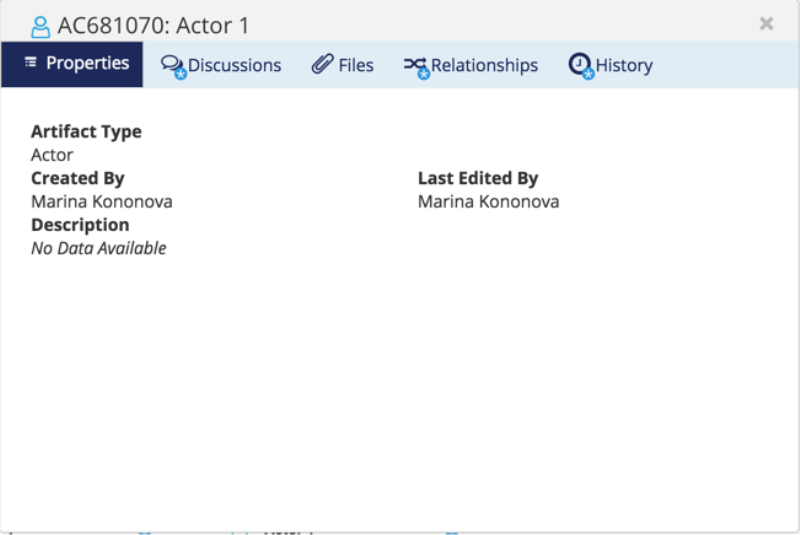
You can access an artifact’s properties, discussions, files, relationships, and history in Impact Analysis. Clicking an artifact will open a window displaying the aforementioned five tabs. All tabs are read-only, with the exception of the Discussion tab – where you can start and reply to discussions.
Note: The discussion feature supports rich text and is a real-time field. The comments you enter will be displayed in Blueprint when you return and refresh the artifact.
Export to Excel
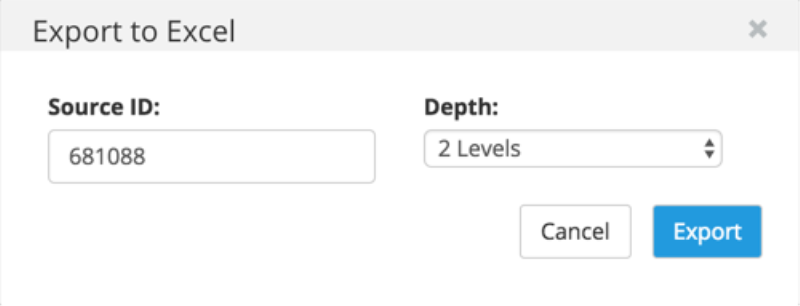
When exporting the Impact tree to Excel, you must select the number of levels you wish to have exported from the source artifact. The maximum Impact Analysis supports is 10 levels. You can also change the source ID, if desired.
Once you have entered your criteria, click the Export button. An Excel file (.xlsx) will be created. The name of the file will represent the choices you have selected in the export window.
Example: Source ID 340342 with 3 levels of depth will be generated as ImpactAnalysis_340342_3.xlsx
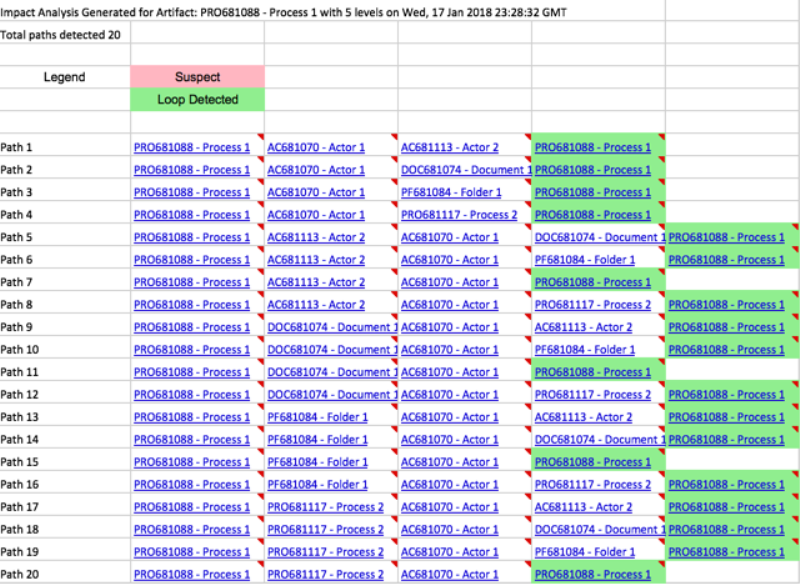
The Excel file will contain a time-stamp, and provides you with a total count of paths that were exported. Each path will display as its own line and will progress until it ends, or a loop is detected (shown in green). Any present suspect traces are shown in red.
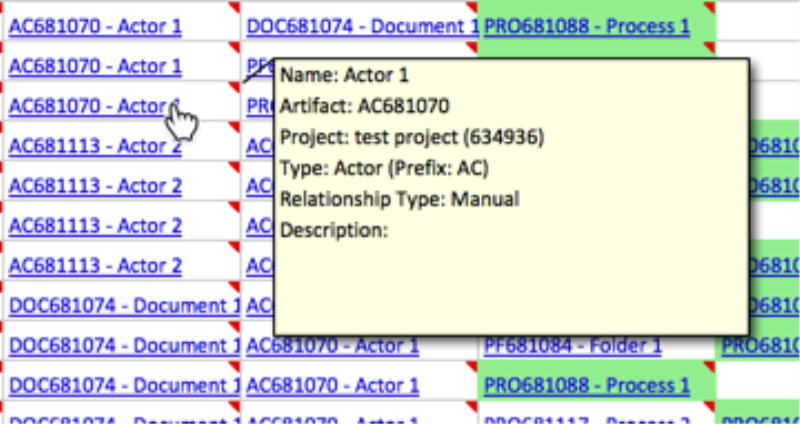
To view the key properties of an artifact, you can hover your mouse over any of the cells with a red triangle indicator in the upper right.

